As conference tournaments begin to conclude, Selection Sunday is nearing and the NCAA Tournament picture is becoming clearer. Some teams have solidified…
The beauty of March Madness is that there is truly a potential path to the national title for everyone in the 68-team field, and without fail, there are a…
As the clock ticks down to Selection Sunday for the 2024 men's NCAA tournament, there are a lot of bracketology-related questions hanging up in the air. What…
Anonymous Resume: Which Teams Are Most Deserving of a 2024 Men's NCAA Tournament Bid?
Kerry Miller
Mar 14, 2024
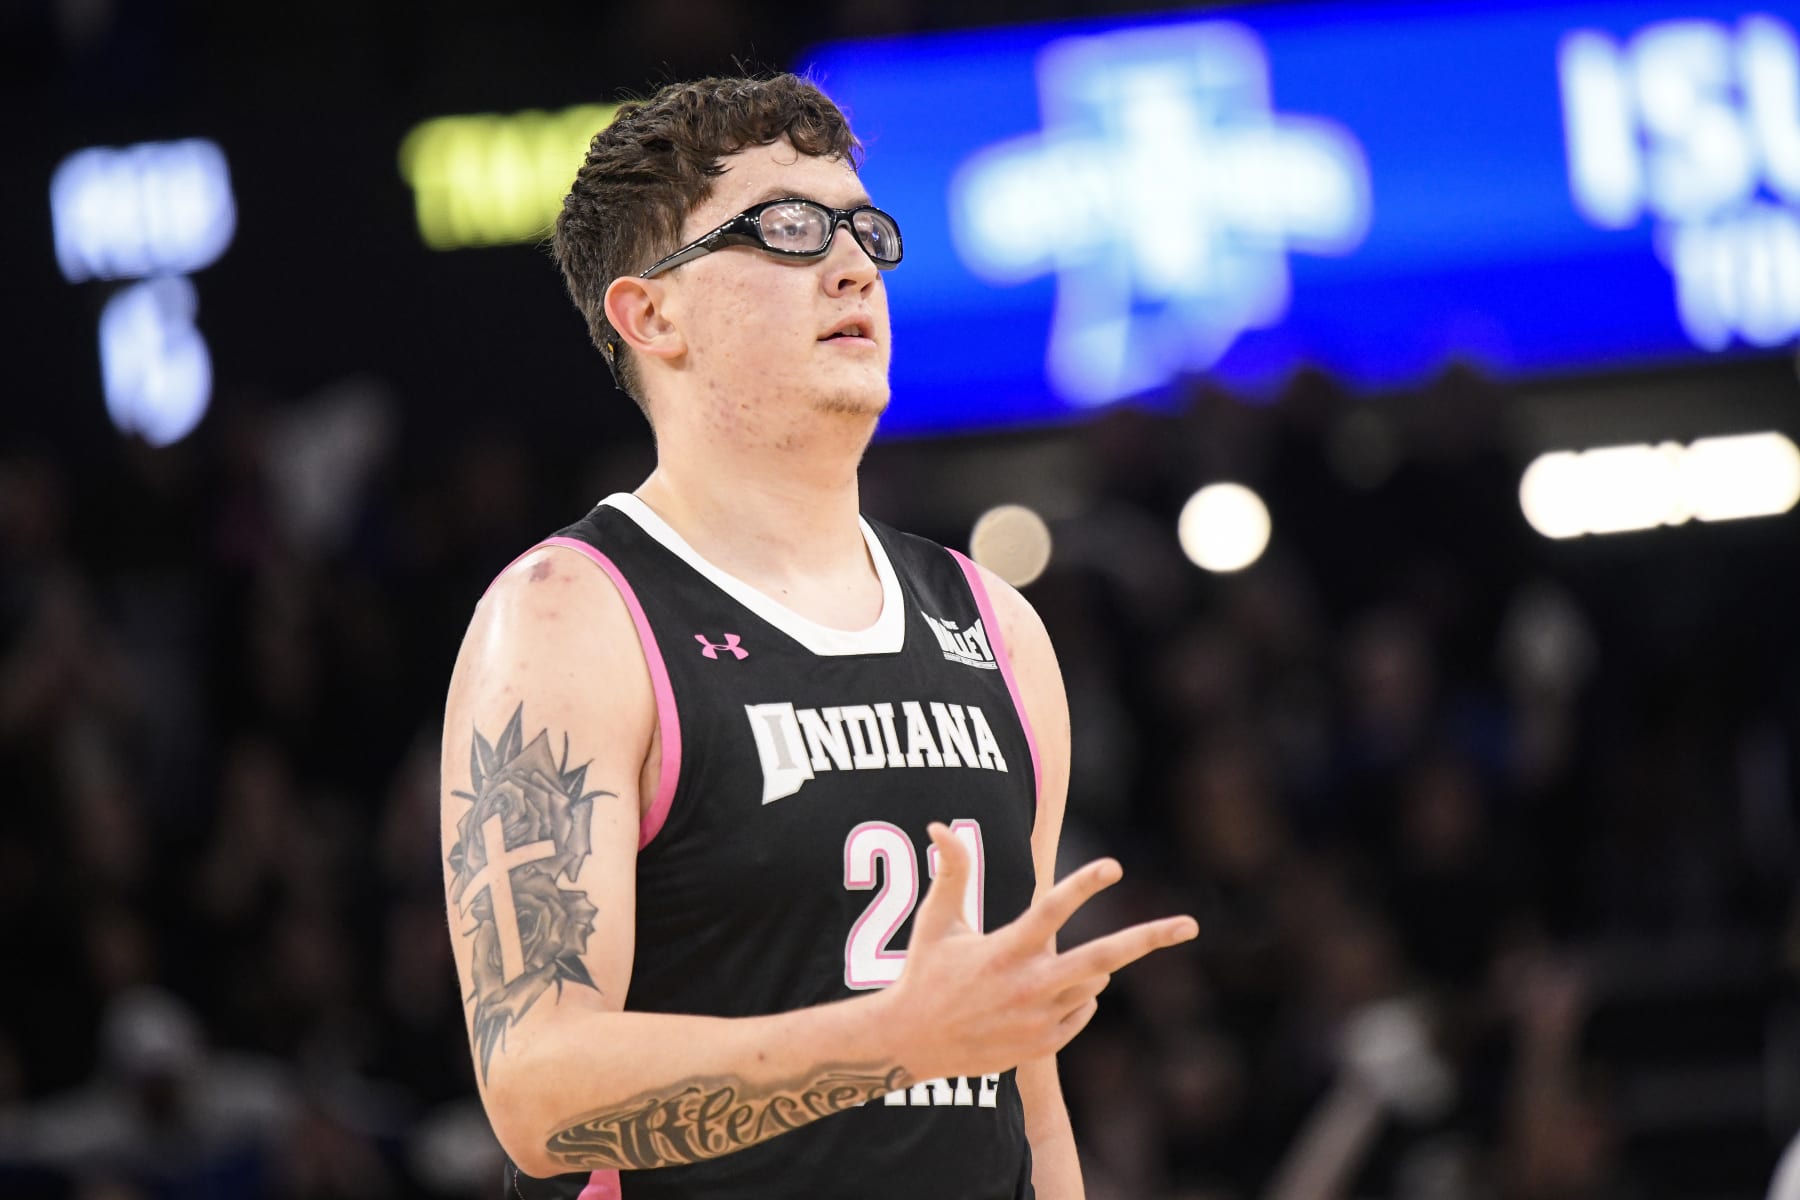
Indiana State's Robbie Avila
Championship week in men's college basketball means the time has finally come for America's favorite game of deceptively partial information: anonymous NCAA tournament resumes.
In theory, the selection committee tries to compare team resumes without any sort of bias. That is both impossible and impractical, because if you've watched as much basketball as these committee members have, all it takes is a quick glance at the list of opponents faced to know whose resume it is.
But we actually can strip away the names and talk almost exclusively in metrics to compare two (or more) teams in anonymity.
On these resumes, you'll find the following acronyms/abbreviations:
NET: NCAA Evaluation Tool. This is the primary sorting metric by which quadrant records are determined. Generally speaking, a team's NET isn't as important as the NET of its opponents, but it still matters to some extent.
RES: Resume or results-based metrics. This is the average of Kevin Pauga Index (KPI) and strength of record (SOR). The lower the number, the better.
QUAL: Quality or predictive metrics. This is the average of KenPom and BPI. Margin of victory is a huge factor here, and again, the lower the number, the better. As a bracketology rule of thumb, RES is much more important when it comes to deciding if a team belongs in the field, while QUAL starts to play a factor in where teams should be seeded. (Frankly, the NET should be a part of this average as well, since it is also a predictive metric. But it is viewed separately as its own sorting tool.)
SOS/NCSOS: Strength of schedule/nonconference strength of schedule. For the most part, this is not important as a standalone data point, as schedule strength is kind of baked into the numbers. But a team with a top-10 schedule might get some benefit of the doubt, while a team that's 300th or worse in NCSOS might get penalized for that lack of effort. More on that shortly.
Q1/Q2/Q3/Q4: The quads. Back in the day, we used to just talk about records against top 50, top 100, etc., but they changed up the team sheets a few years ago to more adequately account for where the games were played.
Quadrant 1 consists of home games against the NET top 30, neutral-site games against the NET top 50 and road games against the NET top 75. Q2 is home vs. 31-75, neutral vs. 51-100 and road vs. 76-135. Q3 is home vs. 76-160, neutral vs. 101-200 and road vs. 136-240. And Q4 is everything else. But don't worry about those actual numbers. Just know that Q1 wins are good and Q4 losses are bad. (Q1A is the top half of Quad 1, or home vs. 1-15, neutral vs. 1-25 and road vs. 1-40. Those are extra nice to have.)
Notably, these are the records that can change overnight when the NET refreshes, making a team suddenly look more attractive or less appealing for no readily apparent reason. My favorite in-season example of this was two weeks ago when Marquette lost at Creighton, but improved from 6-6 vs. Q1 to 8-6 the following morning when its previous home wins over Villanova and Texas improved from Q2 to Q1, because both of those teams climbed from around 35th in NET to marginally in the top 30.
With those glossary notes out of the way, let's dive into the muck.
Anonymous Resume Comparison #1: Predictives vs. Results
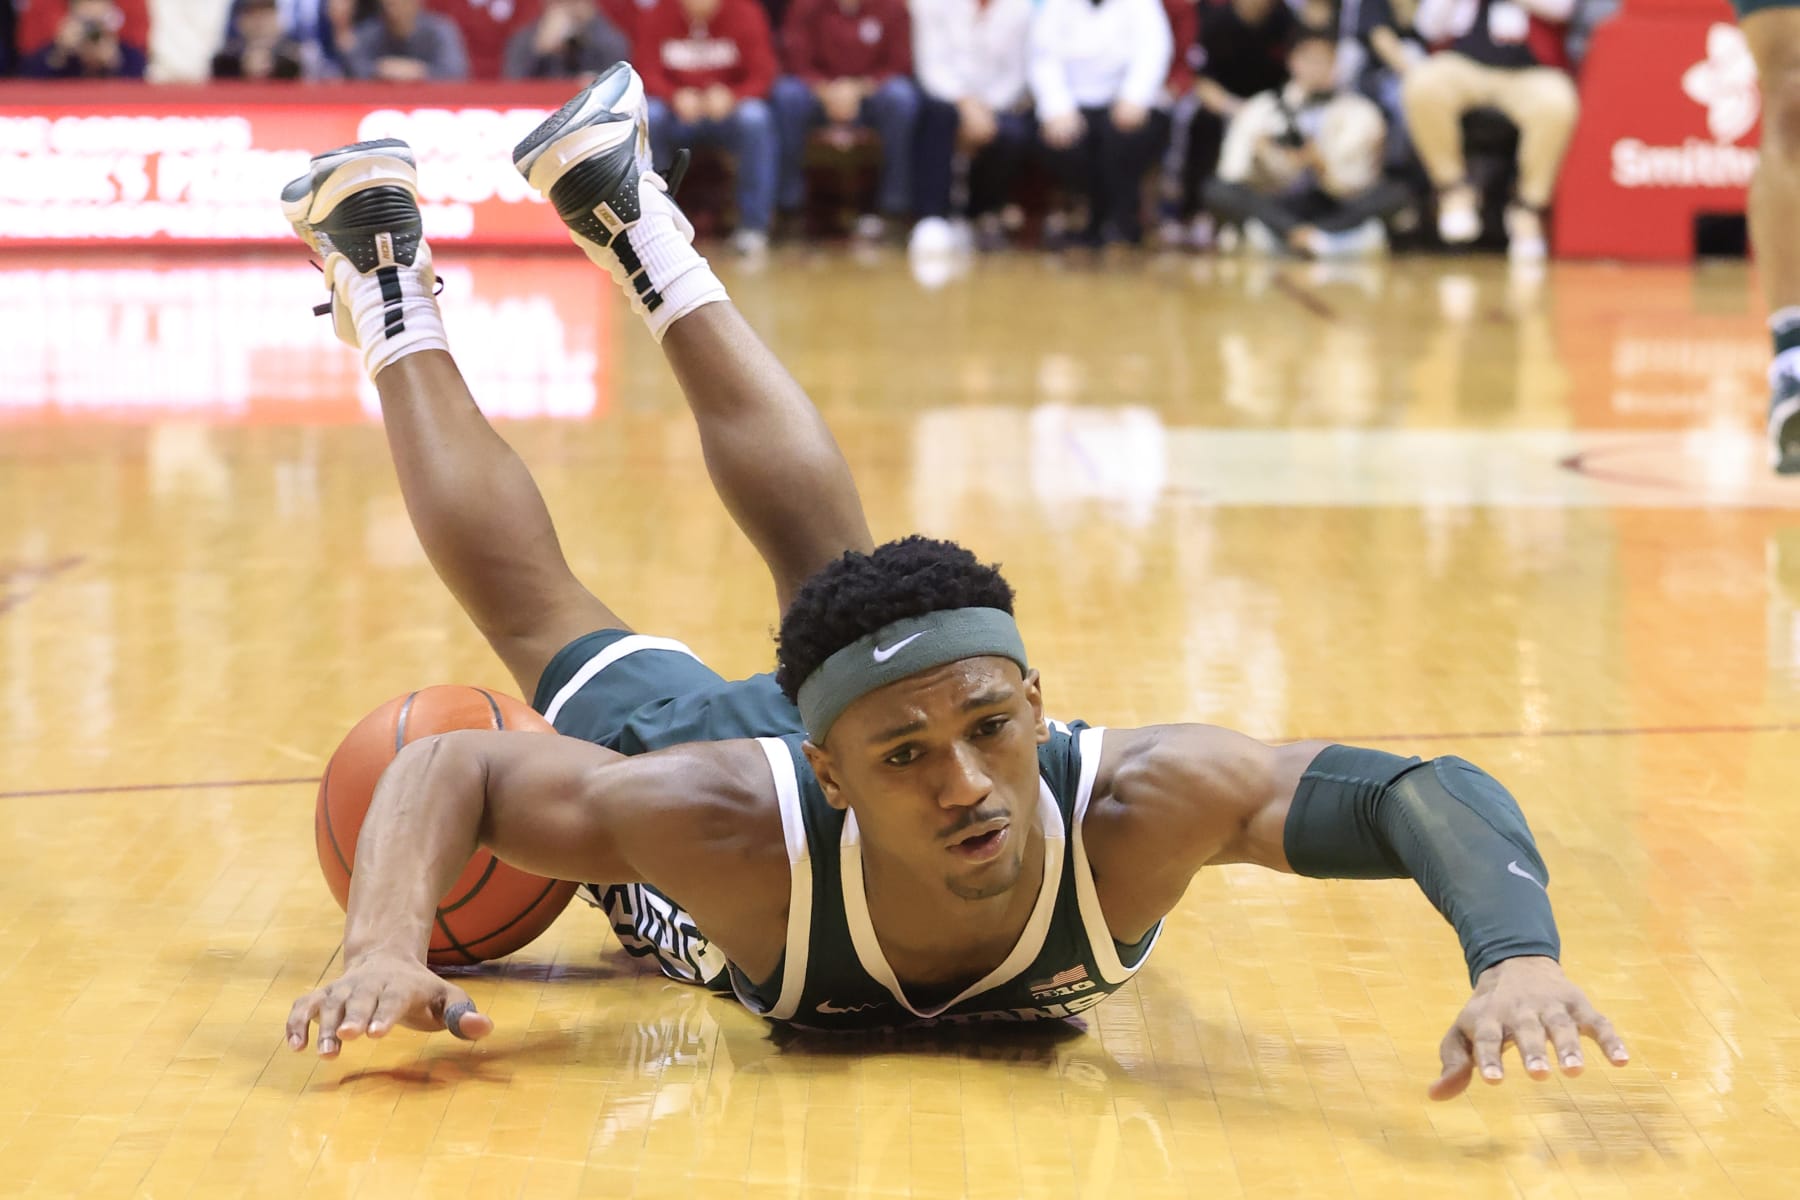
Tyson Walker
Team A: 22-9, NET: 51, RES: 34.5, QUAL: 59.5, 1-4 vs. Q1A, 2-6 vs. Q1, 6-3 vs. Q2, 14-0 vs. Q3/Q4, SOS: 79, NCSOS: 169
Team B: 18-13, NET: 24, RES: 46.0, QUAL: 19.0, 2-6 vs. Q1A, 3-8 vs. Q1, 5-5 vs. Q2, 10-0 vs. Q3/Q4, SOS: 18, NCSOS: 39
Oftentimes, this parlor game is used to trick you into believing that a team nowhere close to the field actually deserves a bid, or that a projected single-digit seed might actually be headed to the NIT. But this is a comparison between two teams smack dab on the bubble, quite possibly destined for a showdown in Dayton early next week.
So, which number stands out the most to you? Is it Team B's troubling quantity of total losses, or its ridiculously impressive predictive metrics? Or maybe it's how none of the predictive metrics paint Team A as a top-50 squad? That seems bad, right?
The problem for Team A is that when it does lose, it gets destroyed. All nine losses have been by double digits for an average margin of defeat of 20.4 points. Compared to Team A's nine losses by a combined 184 points, Team B's 13 losses were by a combined margin of 90 points, often coming right down to the wire.
But is it better to occasionally no-show your way to an 8-9 record vs. Q1/Q2 or consistently lose close games en route to an 8-13 record against that group? Team A ranking somewhat well ahead of Team B in the results-based metrics tells us that the former is better, and that winning 67 percent of games against Q2 is far better than winning 50 percent of them.
What's weird about all of this is that both teams fail the proverbial eye test.
You would think that being top-20 in the predictives would mean Team B (Michigan State) looks a whole lot better than Team A (Virginia), but I'm not even sure if that's true. Yes, the Cavaliers have been a colossal eyesore in their losses, but Sparty has maybe one game per month where it actually looks the part of a tournament team. It's baffling that they've been constantly hanging out in the 15-20 range on KenPom no matter how many times they lose.
Both of these teams have work to do in their conference tournaments, and they would likely drop out of the field with a loss on Thursday.
Anonymous Resume Comparison #2: At Least One of You Tried
Wade Taylor IV
Team C: 18-13, NET: 47, RES: 49.5, QUAL: 42.5, 2-4 vs. Q1A, 5-6 vs. Q1, 6-3 vs. Q2, 2-4 vs. Q3, 5-0 vs. Q4, SOS: 17, NCSOS: 21
Team D: 21-10, NET: 44, RES: 50.5, QUAL: 39.5, 1-4 vs. Q1A, 2-6 vs. Q1, 5-2 vs. Q2, 7-2 vs. Q3, 7-0 vs. Q4, SOS: 83, NCSOS: 342
Purely from a NET/RES/QUAL perspective, these power-conference resumes are darn near identical. But there is one ginormous difference: non-conference strength of schedule.
People get mad that NCSOS doesn't seem to be applied equally throughout the bracket. Iowa State's nonconference schedule was every bit as cream-puffy as Team D's, yet the Cyclones are sitting pretty for no worse than a No. 3 seed. Likewise, Northwestern's NCSOS rank is also well north of 300, but the Wildcats—even with a horrendous home loss to Chicago State on their resume—are viewed by most as a lock, projected for a No. 8/9 seed.
When we get down to the bubble, though, now we suddenly care about whether you tried to do anything in November?
Listen, I agree with you. If it were up to me, teams would be outright ineligible for a top-four seed if they don't meet a certain threshold of "give a darn" when putting together a nonconference schedule. Playing no one for two months would cost you at least one seed line, no matter where you are in the projected field.
But our job is to project what the selection committee will do, and history has shown that NCSOS is only a real problem when you get right down to the cut line. That could be both devastating for Team D and a considerable plus for Team C.
Even without trying to apply any sort of SOS consideration, the Quad 1 record is a gigantic plus for Team C in this comparison. Even though two of those Quad 1 wins were road games against teams around 60th in NET and unlikely to make the field, it would be extremely unusual for a team with five Quad 1 wins and a winning record vs. Q1/Q2 to be left out of the field.
How unusual, you ask? In the three full seasons since the switch to NET (2019, 2022, 2023), 69 teams met that criteria of five Quad 1 wins and a winning Q1/Q2 record. Not only did all 69 get in, but the only one that received a double-digit seed was Seton Hall at No. 38 overall (top half of the No. 10 seed line) in 2019.
Granted, none of those previous teams took four losses outside of the top two Quads, but are we really going to leave out Team C (Texas A&M) for a couple of not-even-that-awful missteps in favor of Team D (Pittsburgh), whose best nonconference wins came against dead-last-in-the-Big 12 West Virginia and dead-last-in-the-Pac-12 Oregon State?
What about the fact that Pitt's by-far best win of the season came against Duke on a night when the Blue Devils were without two starters in Jeremy Roach and Mark Mitchell? Fans may put more of an emphasis on injury situations than the selection committee does, but when we're talking about the Panthers' one big win, it's important to make sure that win passes the smell test.
Texas A&M should be comfortably ahead of Pittsburgh at this point, but there has been quite a push for the Panthers in recent days. They still have a fair amount of work to do, in large part because of their NCSOS. A rank in the mid-300s along the cut line is going to get left out almost every time.
Anonymous Resume Comparison #3: How Much Does NET Actually Matter?
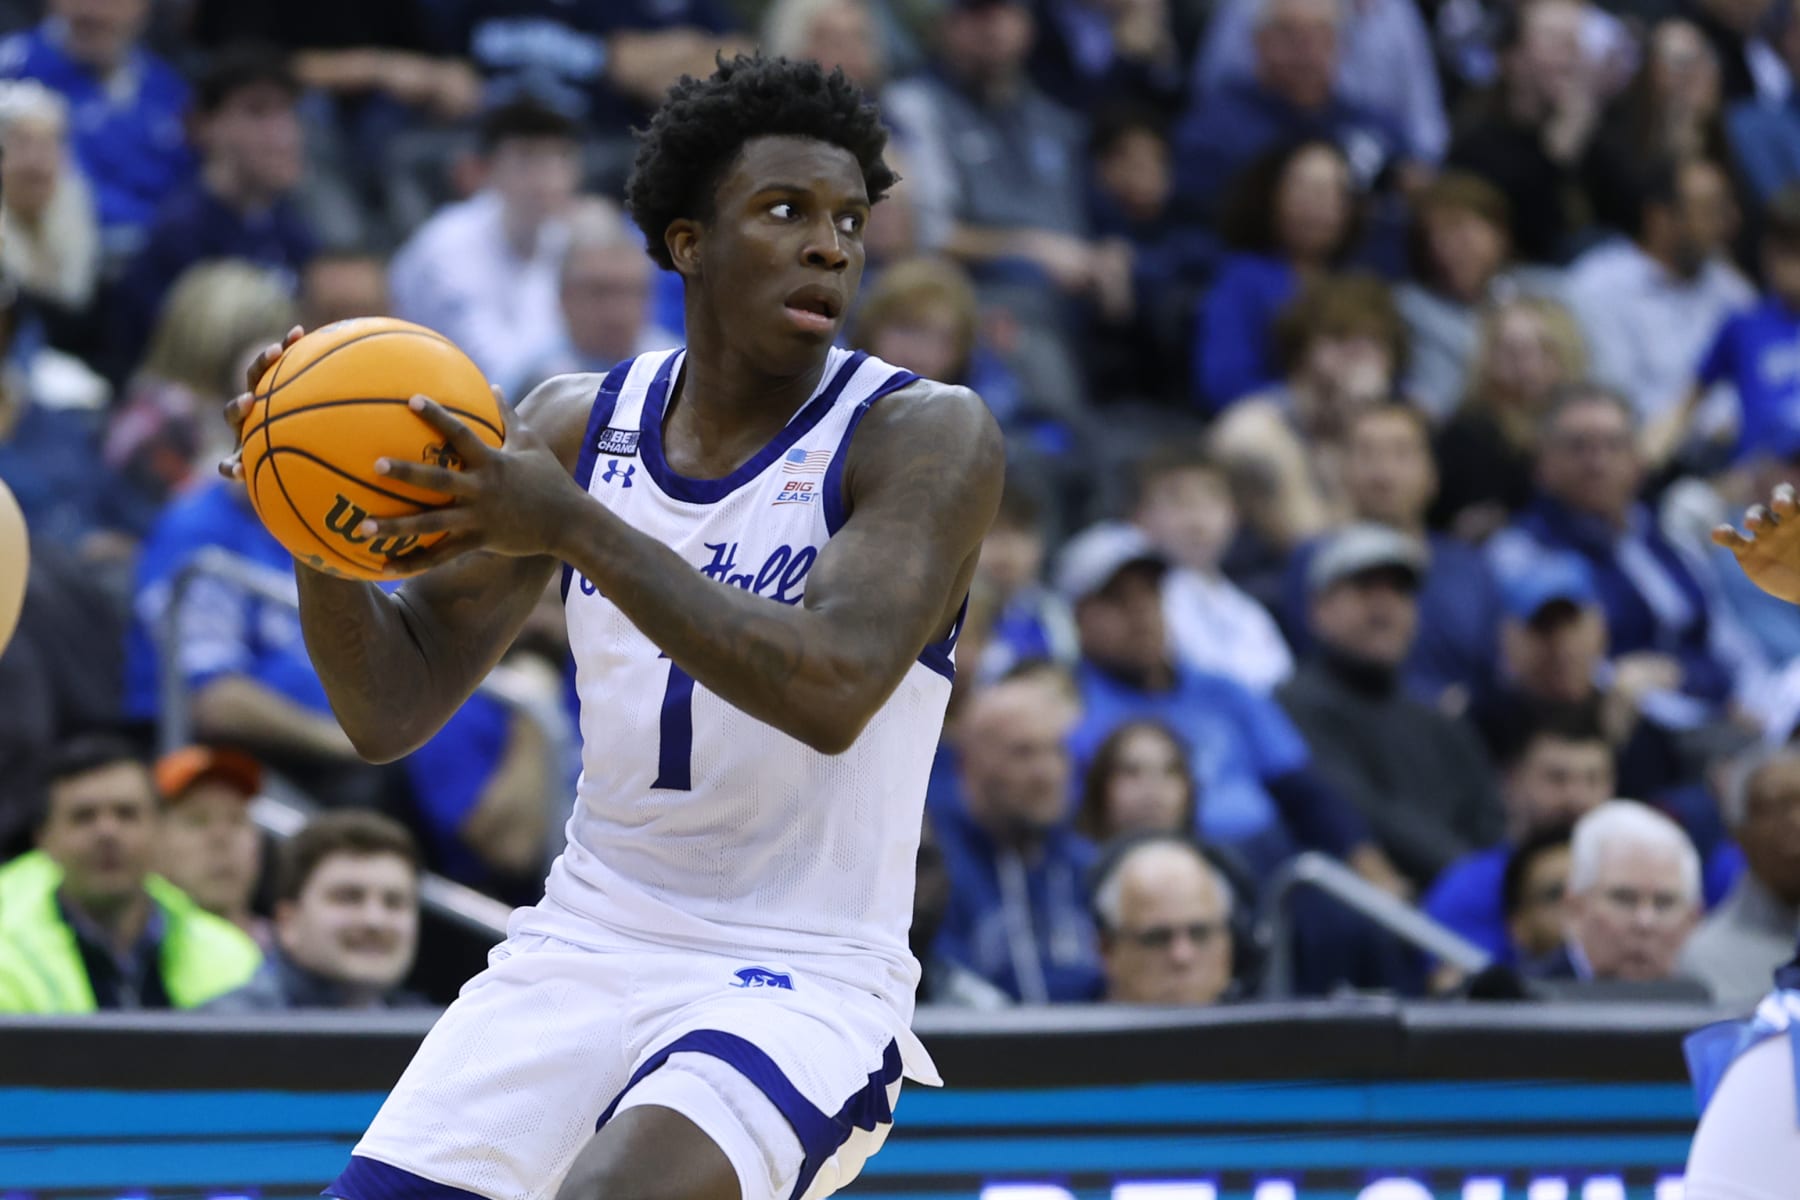
Kadary Richmond
Team F: 19-13, NET: 43, RES: 67.0, QUAL: 37.5, 3-10 vs. Q1, 3-1 vs. Q2, 13-2 vs. Q3/Q4
Team G: 18-13, NET: 52, RES: 63.0, QUAL: 54.0, 4-8 vs. Q1, 4-3 vs. Q2, 10-2 vs. Q3/Q4
Team H: 20-11, NET: 62, RES: 47.0, QUAL: 60.5, 5-7 vs. Q1, 4-3 vs. Q2, 11-1 vs. Q3/Q4
We're going with slightly more condensed versions of the resumes for this one. Not because we're intentionally omitting numbers that might sway you one way or the other, but because there are three teams instead of two and we want to focus on the purpose of this comparison, which is the NET.
The NCAA selection committee's sorting tool has come under quite a bit of criticism this season. Some teams (mostly from the Big 12) arguably "gamed" the NET by putting together weak nonconference schedules and destroying those overmatched foes. That helped artificially boost their efficiency metrics to the point where basically every game in league play looked like a major opportunity for both teams.
I won't rehash that whole debate, but this comparison should demonstrate that a team's NET isn't a particularly important standalone data point when it comes to selecting the field.
Of this trio, you can plainly see that Team H not only has the worst NET but also the worst predictive metrics. That suggests it would be the underdog if it was matched up on a neutral floor against either Team F or Team G.
What's actually important, though, is the ranking in the results-based metrics. Being at 47.0 doesn't make Team H a slam dunk for the field, but ranking outside the top 60 should prove fatal for both Team F and Team G.
Since the switch from RPI to NET for the 2019 NCAA tournament, the worst RES ranking to receive an at-large bid was Rutgers in 2022. That Scarlet Knights team made it in with a 57.5 average, doing so with a remarkable 5-5 record against the top half of Quad 1. (Team F and Team G do not have a similar mark, by the way.)
That Rutgers team also had a NET ranking of 77, as well as a KenPom/BPI average of 74.0, proving that who you beat is much more important than how badly you beat them.
This is why Team H (Seton Hall) should be headed to the tournament, while Team F (Cincinnati) and Team G (Utah) are almost certainly on the outside looking in despite superior predictive metrics.
Having said that, this was written prior to Cincinnati's convincing win over Kansas Wednesday night. That is definitely going to help the Bearcats' metrics, even though the selection committee will surely be aware that the Jayhawks were without their two best players. If they can also knock off Baylor Thursday night, they'll at least be back in the conversation—but almost certainly still well behind Seton Hall.
Anonymous Resume Comparison #4: The Road is Hard (But Necessary)
Hunter Sallis
Team J: 19-12, NET: 38, RES: 57.0, QUAL: 28.0, 1-2 vs. Q1A, 2-5 vs. Q1, 6-6 vs. Q2, 11-1 vs. Q3/Q4, SOS: 71, NCSOS: 253, Road/Neutral Record: 3-11
Team K: 27-6, NET: 29, RES: 41.0, QUAL: 41.0, 0-2, vs. Q1A, 1-4 vs. Q1, 4-1 vs. Q2, 22-1 vs. Q3/Q4, SOS: 130, NCSOS: 187, Road/Neutral Record: 15-5
We added something extra to the resumes for this final comparison, but it's a key factor that often gets overlooked in our bubble discussions: the ability to win away from home.
It did come up quite a bit this season with regard to both Nebraska and Northwestern in the Big Ten. But both of those teams did just enough down the stretch on the road against the bottom half of the league to make their road/neutral record more palatable while playing their way off the bubble.
Team J, on the other hand, did not. Not only did Team J cobble together a pathetic 3-11 record away from home, but here are the NET rankings of those games:
Wins: at 91, at 126, 147 neutral
Losses: at 7, at 10, at 44, at 51, 52 neutral, at 56, at 79, 93 neutral, at 96, at 101, at 121
The losses to NET Nos. 7 and 10 are perfectly understandable. Even 44, 51 and 56 are kind of whatever. Those are Quad 1 games. They're supposed to be tough to get, even for teams near the bubble.
But the six Quad 2 losses are hard to stomach, as is the complete lack of wins away from home against teams in the top 90.
In considerably fewer chances, Team K at least got one Quad 1 win away from home, went 2-1 on the road against Quad 2 and went a perfect 12-0 away from home against Quads 3 and 4.
As a result, Team K (Indiana State) clearly has a better overall resume than Team J (Wake Forest). For now, anyway.
The problem for the Sycamores is that they are finished playing, while the Demon Deacons and a whole bunch of other teams on the bubble still have a chance to improve their resume in these final few days.
Indiana State arguably should be in the field today, but there's a lot of pessimism around the bracketology world whether it will still be worthy of a bid by Selection Sunday.
One big thing working in Indiana State's favor is that there simply aren't many mid-majors in the conversation for at-large bids this year.
Drake, James Madison and Samford have already secured automatic bids, and Princeton, McNeese State and Grand Canyon will likely all do the same. If that's the case, it'll just be Indiana State—and, with a much less compelling argument, Appalachian State—sitting there with 27-plus wins on the bubble.
That and the 15 wins away from home should bode well for the Trees.
All records and metrics current as of Wednesday morning.
The 2023-24 men's college basketball regular season has come to a close and mid-major conference tournaments are already in full swing, but there is still…
Men's NCAA Bracketology 2024: Real-Time Seed and Region Projections for All 68 Teams
Kerry Miller
Mar 12, 2024
Connecticut's Cam Spencer
So you think March Madness doesn't start until next week, eh?
Last Updated: FINAL
The past four days were nothing short of insanity, but Saturday really drove that home with bid thieves in each of the ACC, AAC and Pac-12, shrinking the bubble to such an extreme that we're currently projecting a No. 10 seed for a play-in game, which has never happened before.
It's plausible that both play-in games will be No. 10 seeds this year.
In a word: Madness.
With all 32 conference tournaments finished, here is our projection for what the NCAA tournament selection committee will give us.
If I under-seeded your team, I apologize. If I over-seeded your team, you're welcome. But hopefully you enjoyed the ride as much as I did. Selection Sunday is the final exam for me as a bracketologist, but I like to think it's only 20 percent of my grade for the year. The rest is making the journey from early November until mid-March more enjoyable and informative, which was most certainly accomplished.
Now, let's see how I did.
Sign up to Play the NCAA March Madness Men's Bracket Challenge, Tournament Run, and Conference Tournament Pick Em.
Midwest No. 16 Play-In Game: Wagner vs. Howard
Midwest No. 11 Play-In Game: Florida Atlantic vs. Michigan State
West No. 16 Play-In Game: Grambling State vs. Montana State
South No. 10 Play-In Game: Colorado vs. Oklahoma
10 Words on Each of the 10 'Bubbliest' Teams (Metrics will be updated and bubble will be scrubbed around noon ET each day):
Fourth-to-Last In: Colorado Buffaloes (24-10, NET: 25, RES: 34.5, QUAL: 35.5)—For letting Oregon in, Colorado has to go to Dayton.
Third-to-Last In: Oklahoma Sooners (20-12, NET: 46, RES: 40.5, QUAL: 41.0)—Been a lot of teams playing their way past Oklahoma...
Second-to-Last In: Michigan State Spartans (19-14, NET: 24, RES: 47.5, QUAL: 19.0)—Resume probably good enough, but beating Purdue would've clinched it.
Last Team In: Florida Atlantic Owls (25-8, NET: 39, RES: 36.5, QUAL: 38.0)—Loss to Temple might have been final nail in coffin.
****CUT LINE****
First Team Out: St. John's Red Storm (20-13, NET: 32, RES: 58.5, QUAL: 25.0)—Worst RES to dance in NET era? 2022 Rutgers (57.5).
Second Team Out: Virginia Cavaliers (23-10, NET: 54, RES: 34.0, QUAL: 62.0)—Failing to foul up three might cost UVA a bid.
Third Team Out: Indiana State Sycamores (27-6, NET: 29, RES: 39.5, QUAL: 43.0)—My heart says "yes!" but my brain says "might miss."
Fourth Team Out: Providence Friars (21-13, NET: 57, RES: 55.5, QUAL: 49.5)—Three games below .500 vs. Q1-Q3 historically isn't good enough.
Fifth Team Out: Pittsburgh Panthers (22-11, NET: 40, RES: 51.5, QUAL: 36.5)—When selecting final teams, Pitt's 342nd-ranked NCSOS will be problematic.
Sixth Team Out: Seton Hall Pirates (20-12, NET: 67, RES: 51.0, QUAL: 65.5)—Of the five metrics, one rates Seton Hall top 60.
Sunday Morning Scrub
It's a tradition like no other: After three days of complete carnage, I pour myself a cup of coffee and work line by line through the bracket to see if anything needs to change.
I try not to change much, because that's where you get into trouble. But the big one is swapping Kansas and Duke as the bottom No. 3 seed and top No. 4 seed. Despite many instances of the selection committee giving the Blue Devils a slightly higher seed than they deserve, the combination of Kansas' superior top-end metrics and the constant talk in recent days about Kevin McCullar Jr. and Hunter Dickinson being healthy for the dance pushed me over the edge. Can't wait to be wrong on that one.
Beyond that, the only other seed line change outside of the Nos. 12-16 seed auto bids was Dayton moving up to replace Northwestern on the No. 8 line. Thinking I over-penalized the Flyers for dropping them from No. 28 to No. 33 for the loss to Duquesne, and never quite penalized Northwestern enough for a poor NET, a terrible NCSOS and an awful home loss to Chicago State. It only changes the jersey color those teams will wear, though.
Thought about trying to scrub St. John's back into the field at the expense of Florida Atlantic, but opted to leave well enough alone. I've gone cross-eyed looking at those bubble teams over the past few days, and if the committee already had FAU in the field prior to its loss to Temple, it isn't going to punt those Owls all the way out. But, man, it is hard to justify leaving all three of those Big East bubble teams out, especially to reward both Michigan State and Florida Atlantic, who did very little as far as high-end wins are concerned. Got to stick with what we already had, though.
One final scrubbing note: Had to rearrange the SEC's No. 4 seeds for purposes of first and second-round sites in regard to BYU, which will not play on Sundays. We now have Kentucky in the West Region, but starting its run in Pittsburgh (where John Calipari is from, by the way. Moon Township, represent.) And now both Auburn and Alabama will start out in Spokane.
Seeding by Conference (punched tickets are underlined)
A-10 (2): 32. Dayton; 49. Duquesne
AAC (2): 44. Florida Atlantic; 51. UAB
ACC (4): 4. North Carolina; 13. Duke; 25. Clemson; 45. North Carolina State
Four of the 32 automatic tickets for the 2024 men's NCAA tournament have already been punched, but this is where Championship "Week" really starts cooking…
Some of the most electric offenses in men's college basketball could face off in the first round of the NCAA men's basketball tournament. The Kentucky…
Welcome to Championship Week for the 2024 men's college basketball season. Believe it or not, there are conference tournament games getting underway Monday…